Figure 9
Coronavirus COVID-19 surface properties: Electrical charges status
Luisetto M*, Tarro G, Khaled Edbey, Farhan Ahmad Khan, Yesvi AR, Nili BA, Fiazza C, Mashori GR, President, IMA Academy and Italy
Published: 13 April, 2021 | Volume 4 - Issue 1 | Pages: 016-027
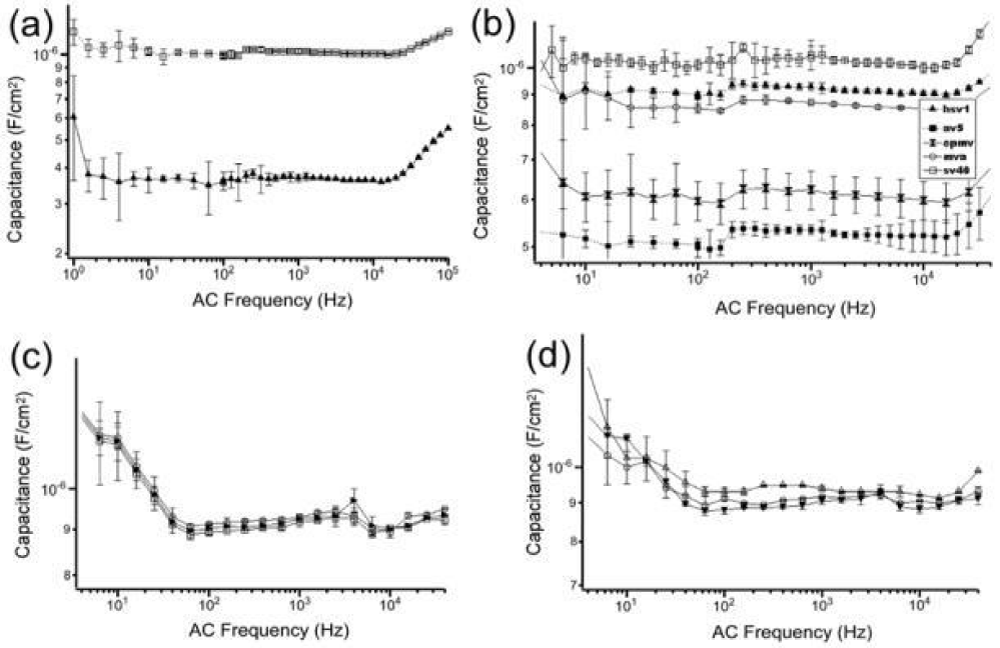
Figure 9:
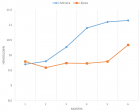
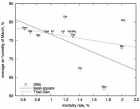
Capacitance -spectra of (a) polystyrene (□) and PMMA (▲) nanoparticles (b) Capacitance spectra of AV5, CPMV, MVA, SV40, and HSV1 (c) HSV1 with the tip forces, 50 nN (U+02680), 200 nN (□), and 500 nN (○) (d) HSV1 at humidity -level 10% (△), 50% (○), and 70% (▼).shows capacitances of five types of viruses; adenovirus type 5 (AV 5), herpes simplex- virus type 1 (HSV1), simian virus 40 (SV40), vaccinia (MVA), and cowpea mosaic virus -(CPMV). Their impedance signals were averaged 1–10 seconds for each AC frequency at 10 mV of AC bias. For each type of virus, fifty different particles were measured and collected capacitance- spectra were averaged with error bars and normalized by the size of each virus, as shown in Figure (b). In this figure, SV40 showed the highest capacitance while AV5 had the lowest.
Read Full Article HTML DOI: 10.29328/journal.ijcmbt.1001021 Cite this Article Read Full Article PDF
More Images
Similar Articles
-
Estimating global case fatality rate of coronavirus disease 2019 (COVID-19) pandemicShyamapada Mandal*,Manisha Mandal. Estimating global case fatality rate of coronavirus disease 2019 (COVID-19) pandemic. . 2020 doi: 10.29328/journal.ijcmbt.1001014; 3: 036-039
-
The clinicopathological correlates of Cystoisosporiasis in immunocompetent, immunocompromised and HIV-infected/AIDS patients, but neglected in SARS-COV-2/COVID-19 patients?Chrysanthus Chukwuma Sr*. The clinicopathological correlates of Cystoisosporiasis in immunocompetent, immunocompromised and HIV-infected/AIDS patients, but neglected in SARS-COV-2/COVID-19 patients?. . 2021 doi: 10.29328/journal.ijcmbt.1001018; 4: 001-004
-
Explicating the presentations of Acanthamoeba keratitis with special concern in the COVID-19 pandemic ambientChrysanthus Chukwuma Sr*. Explicating the presentations of Acanthamoeba keratitis with special concern in the COVID-19 pandemic ambient. . 2021 doi: 10.29328/journal.ijcmbt.1001020; 4: 010-015
-
Coronavirus COVID-19 surface properties: Electrical charges statusLuisetto M*,Tarro G,Khaled Edbey,Farhan Ahmad Khan,Yesvi AR,Nili BA,Fiazza C,Mashori GR,President, IMA Academy, Italy. Coronavirus COVID-19 surface properties: Electrical charges status. . 2021 doi: 10.29328/journal.ijcmbt.1001021; 4: 016-027
-
Incidence of hepatitis B and hepatitis C in Pediatric ward in 2ed March teaching hospital, Sebha: South of LibyaIdress H Attitalla*,Shaban R Bagar,Marei A Altayar,Abdlmanam Fakron,Hosam B Bahnosy. Incidence of hepatitis B and hepatitis C in Pediatric ward in 2ed March teaching hospital, Sebha: South of Libya. . 2021 doi: 10.29328/journal.ijcmbt.1001022; 4: 028-031
Recently Viewed
-
Unusual Complications of a Dental Prosthesis Esophageal Foreign Body: About a CaseRichard Edward Alain Deguenonvo,Ndèye Fatou Thiam*,Mouhamadou Diouldé Diallo,Abdou Sy,Amadou Thiam,Abdoulaye Diop,Mame Sanou Diouf,Baye Karim Diallo. Unusual Complications of a Dental Prosthesis Esophageal Foreign Body: About a Case. Adv Treat ENT Disord. 2025: doi: 10.29328/journal.ated.1001016; 9: 001-004
-
Strengthening Healthcare Delivery in the Democratic Republic of Congo through Adequate Nursing WorkforceMin Kyung Shin, Tshibambe N Tshimbombu*. Strengthening Healthcare Delivery in the Democratic Republic of Congo through Adequate Nursing Workforce. Clin J Nurs Care Pract. 2024: doi: 10.29328/journal.cjncp.1001051; 8: 007-010
-
Chemical constituents and biological activities of Artocarpus heterophyllus lam (Jackfruit): A reviewSibi G*,Pranay Raja Bhad,Meeneri Vilas Bobde. Chemical constituents and biological activities of Artocarpus heterophyllus lam (Jackfruit): A review. Int J Clin Microbiol Biochem Technol. 2021: doi: 10.29328/journal.ijcmbt.1001019; 4: 005-009
-
The clinicopathological correlates of Cystoisosporiasis in immunocompetent, immunocompromised and HIV-infected/AIDS patients, but neglected in SARS-COV-2/COVID-19 patients?Chrysanthus Chukwuma Sr*. The clinicopathological correlates of Cystoisosporiasis in immunocompetent, immunocompromised and HIV-infected/AIDS patients, but neglected in SARS-COV-2/COVID-19 patients?. Int J Clin Microbiol Biochem Technol. 2021: doi: 10.29328/journal.ijcmbt.1001018; 4: 001-004
-
Explicating the presentations of Acanthamoeba keratitis with special concern in the COVID-19 pandemic ambientChrysanthus Chukwuma Sr*. Explicating the presentations of Acanthamoeba keratitis with special concern in the COVID-19 pandemic ambient. Int J Clin Microbiol Biochem Technol. 2021: doi: 10.29328/journal.ijcmbt.1001020; 4: 010-015
Most Viewed
-
Evaluation of Biostimulants Based on Recovered Protein Hydrolysates from Animal By-products as Plant Growth EnhancersH Pérez-Aguilar*, M Lacruz-Asaro, F Arán-Ais. Evaluation of Biostimulants Based on Recovered Protein Hydrolysates from Animal By-products as Plant Growth Enhancers. J Plant Sci Phytopathol. 2023 doi: 10.29328/journal.jpsp.1001104; 7: 042-047
-
Sinonasal Myxoma Extending into the Orbit in a 4-Year Old: A Case PresentationJulian A Purrinos*, Ramzi Younis. Sinonasal Myxoma Extending into the Orbit in a 4-Year Old: A Case Presentation. Arch Case Rep. 2024 doi: 10.29328/journal.acr.1001099; 8: 075-077
-
Feasibility study of magnetic sensing for detecting single-neuron action potentialsDenis Tonini,Kai Wu,Renata Saha,Jian-Ping Wang*. Feasibility study of magnetic sensing for detecting single-neuron action potentials. Ann Biomed Sci Eng. 2022 doi: 10.29328/journal.abse.1001018; 6: 019-029
-
Pediatric Dysgerminoma: Unveiling a Rare Ovarian TumorFaten Limaiem*, Khalil Saffar, Ahmed Halouani. Pediatric Dysgerminoma: Unveiling a Rare Ovarian Tumor. Arch Case Rep. 2024 doi: 10.29328/journal.acr.1001087; 8: 010-013
-
Physical activity can change the physiological and psychological circumstances during COVID-19 pandemic: A narrative reviewKhashayar Maroufi*. Physical activity can change the physiological and psychological circumstances during COVID-19 pandemic: A narrative review. J Sports Med Ther. 2021 doi: 10.29328/journal.jsmt.1001051; 6: 001-007

HSPI: We're glad you're here. Please click "create a new Query" if you are a new visitor to our website and need further information from us.
If you are already a member of our network and need to keep track of any developments regarding a question you have already submitted, click "take me to my Query."


