Figure 7
Coronavirus COVID-19 surface properties: Electrical charges status
Luisetto M*, Tarro G, Khaled Edbey, Farhan Ahmad Khan, Yesvi AR, Nili BA, Fiazza C, Mashori GR, President, IMA Academy and Italy
Published: 13 April, 2021 | Volume 4 - Issue 1 | Pages: 016-027
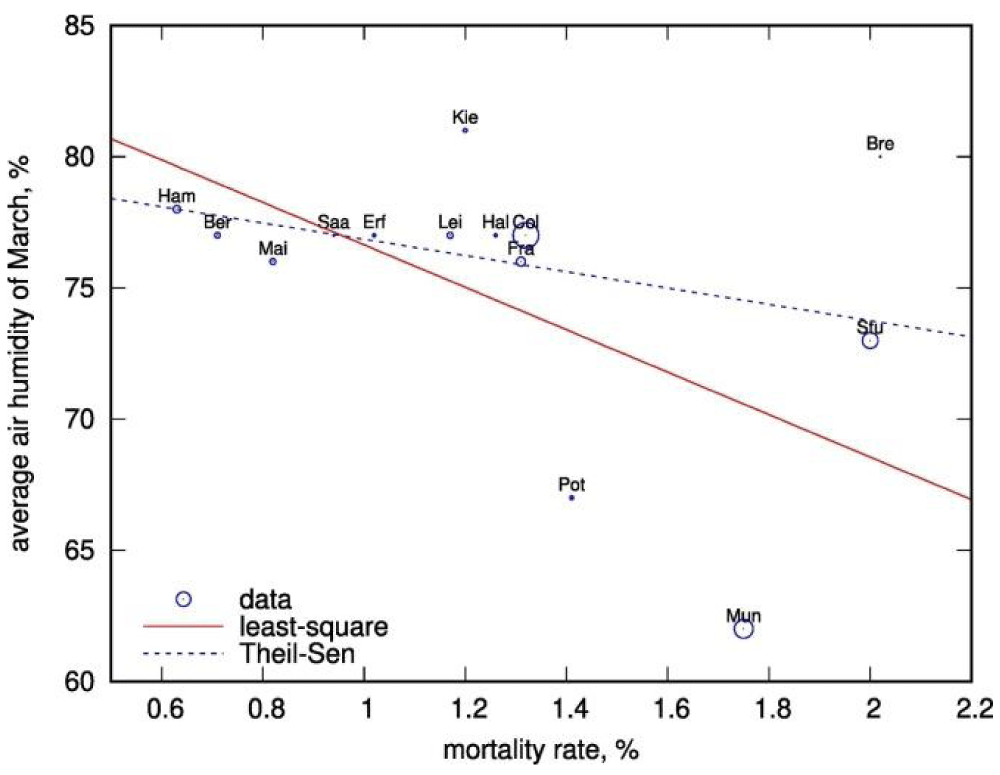
Figure 7:
Air- humidity in March vs COVID-19 mortality in German federal- states (circles). The size of the circles is proportional to the population of the federal- state; the labels are abbreviations for the largest cities of the federal lands. Red solid line shows the linear regression. Theil-Sen regression is shown with the blue dashed -line.
Read Full Article HTML DOI: 10.29328/journal.ijcmbt.1001021 Cite this Article Read Full Article PDF
More Images
Similar Articles
-
Estimating global case fatality rate of coronavirus disease 2019 (COVID-19) pandemicShyamapada Mandal*,Manisha Mandal. Estimating global case fatality rate of coronavirus disease 2019 (COVID-19) pandemic. . 2020 doi: 10.29328/journal.ijcmbt.1001014; 3: 036-039
-
The clinicopathological correlates of Cystoisosporiasis in immunocompetent, immunocompromised and HIV-infected/AIDS patients, but neglected in SARS-COV-2/COVID-19 patients?Chrysanthus Chukwuma Sr*. The clinicopathological correlates of Cystoisosporiasis in immunocompetent, immunocompromised and HIV-infected/AIDS patients, but neglected in SARS-COV-2/COVID-19 patients?. . 2021 doi: 10.29328/journal.ijcmbt.1001018; 4: 001-004
-
Explicating the presentations of Acanthamoeba keratitis with special concern in the COVID-19 pandemic ambientChrysanthus Chukwuma Sr*. Explicating the presentations of Acanthamoeba keratitis with special concern in the COVID-19 pandemic ambient. . 2021 doi: 10.29328/journal.ijcmbt.1001020; 4: 010-015
-
Coronavirus COVID-19 surface properties: Electrical charges statusLuisetto M*,Tarro G,Khaled Edbey,Farhan Ahmad Khan,Yesvi AR,Nili BA,Fiazza C,Mashori GR,President, IMA Academy, Italy. Coronavirus COVID-19 surface properties: Electrical charges status. . 2021 doi: 10.29328/journal.ijcmbt.1001021; 4: 016-027
-
Incidence of hepatitis B and hepatitis C in Pediatric ward in 2ed March teaching hospital, Sebha: South of LibyaIdress H Attitalla*,Shaban R Bagar,Marei A Altayar,Abdlmanam Fakron,Hosam B Bahnosy. Incidence of hepatitis B and hepatitis C in Pediatric ward in 2ed March teaching hospital, Sebha: South of Libya. . 2021 doi: 10.29328/journal.ijcmbt.1001022; 4: 028-031
Recently Viewed
-
Gilbert’s Syndrome Revealed by Hepatotoxicity of ImatinibImen Ben Amor*,Imen Frikha,Moez Medhaffer,Moez Elloumi. Gilbert’s Syndrome Revealed by Hepatotoxicity of Imatinib. Ann Clin Gastroenterol Hepatol. 2025: doi: 10.29328/journal.acgh.1001049; 9: 001-003
-
Unusual Complications of a Dental Prosthesis Esophageal Foreign Body: About a CaseRichard Edward Alain Deguenonvo,Ndèye Fatou Thiam*,Mouhamadou Diouldé Diallo,Abdou Sy,Amadou Thiam,Abdoulaye Diop,Mame Sanou Diouf,Baye Karim Diallo. Unusual Complications of a Dental Prosthesis Esophageal Foreign Body: About a Case. Adv Treat ENT Disord. 2025: doi: 10.29328/journal.ated.1001016; 9: 001-004
-
Strengthening Healthcare Delivery in the Democratic Republic of Congo through Adequate Nursing WorkforceMin Kyung Shin, Tshibambe N Tshimbombu*. Strengthening Healthcare Delivery in the Democratic Republic of Congo through Adequate Nursing Workforce. Clin J Nurs Care Pract. 2024: doi: 10.29328/journal.cjncp.1001051; 8: 007-010
-
Chemical constituents and biological activities of Artocarpus heterophyllus lam (Jackfruit): A reviewSibi G*,Pranay Raja Bhad,Meeneri Vilas Bobde. Chemical constituents and biological activities of Artocarpus heterophyllus lam (Jackfruit): A review. Int J Clin Microbiol Biochem Technol. 2021: doi: 10.29328/journal.ijcmbt.1001019; 4: 005-009
-
The clinicopathological correlates of Cystoisosporiasis in immunocompetent, immunocompromised and HIV-infected/AIDS patients, but neglected in SARS-COV-2/COVID-19 patients?Chrysanthus Chukwuma Sr*. The clinicopathological correlates of Cystoisosporiasis in immunocompetent, immunocompromised and HIV-infected/AIDS patients, but neglected in SARS-COV-2/COVID-19 patients?. Int J Clin Microbiol Biochem Technol. 2021: doi: 10.29328/journal.ijcmbt.1001018; 4: 001-004
Most Viewed
-
Evaluation of Biostimulants Based on Recovered Protein Hydrolysates from Animal By-products as Plant Growth EnhancersH Pérez-Aguilar*, M Lacruz-Asaro, F Arán-Ais. Evaluation of Biostimulants Based on Recovered Protein Hydrolysates from Animal By-products as Plant Growth Enhancers. J Plant Sci Phytopathol. 2023 doi: 10.29328/journal.jpsp.1001104; 7: 042-047
-
Sinonasal Myxoma Extending into the Orbit in a 4-Year Old: A Case PresentationJulian A Purrinos*, Ramzi Younis. Sinonasal Myxoma Extending into the Orbit in a 4-Year Old: A Case Presentation. Arch Case Rep. 2024 doi: 10.29328/journal.acr.1001099; 8: 075-077
-
Feasibility study of magnetic sensing for detecting single-neuron action potentialsDenis Tonini,Kai Wu,Renata Saha,Jian-Ping Wang*. Feasibility study of magnetic sensing for detecting single-neuron action potentials. Ann Biomed Sci Eng. 2022 doi: 10.29328/journal.abse.1001018; 6: 019-029
-
Pediatric Dysgerminoma: Unveiling a Rare Ovarian TumorFaten Limaiem*, Khalil Saffar, Ahmed Halouani. Pediatric Dysgerminoma: Unveiling a Rare Ovarian Tumor. Arch Case Rep. 2024 doi: 10.29328/journal.acr.1001087; 8: 010-013
-
Physical activity can change the physiological and psychological circumstances during COVID-19 pandemic: A narrative reviewKhashayar Maroufi*. Physical activity can change the physiological and psychological circumstances during COVID-19 pandemic: A narrative review. J Sports Med Ther. 2021 doi: 10.29328/journal.jsmt.1001051; 6: 001-007

HSPI: We're glad you're here. Please click "create a new Query" if you are a new visitor to our website and need further information from us.
If you are already a member of our network and need to keep track of any developments regarding a question you have already submitted, click "take me to my Query."


